Getting Started with Classification Models
Contents
Getting Started with Classification Models
Goals
Define machine learning and describe the seven steps used to build machine learning models of data.
Explain what a classification problem is, and the concepts of false positives and false negatives.
Make a data set that could be used for classification and plot the data
0. Our Imports
import matplotlib.pyplot as plt
from sklearn.datasets import make_classification
1. A quick introduction to machine learning
In this notebook, we’ll begin our dive more into Machine Learning. The two videos included below should give you a basic understanding for what machine learning is and how it is used.
Watch the videos and answer the questions.
from IPython.display import YouTubeVideo
YouTubeVideo("HcqpanDadyQ",width=640,height=360)
Question 1 : List three examples of machine learning in our world today.
✎ Do This - Erase the contents of this cell and replace it with your answer to the above question! (double-click on this text to edit this cell, and hit shift+enter to save the text)
Question 2: According to video, what is the definition of machine learning?
✎ Do This - Erase the contents of this cell and replace it with your answer to the above question! (double-click on this text to edit this cell, and hit shift+enter to save the text)
from IPython.display import YouTubeVideo
YouTubeVideo("nKW8Ndu7Mjw",width=640,height=360)
Question 3: Why might it be important to seperate the testing data from the training data ?
✎ Do This - Erase the contents of this cell and replace it with your answer to the above question! (double-click on this text to edit this cell, and hit shift+enter to save the text)
Question 4: Why is it important to prepare data before putting it in to a model?
✎ Do This - Erase the contents of this cell and replace it with your answer to the above question! (double-click on this text to edit this cell, and hit shift+enter to save the text)
Question 5: The video is about the “7 Steps of Machine Learning”. Those steps are reproduced below. In your own words, try to explain what each of those steps involve with a sentence or two.
✎ Do This - Fill out the 7 Steps of Machine Learning:
Gathering data involves…
Preparing that Data involves…
Choosing a Model involves…
Training involves…
Evaluation involves…
Hyperparameter Tuning involves…
Prediction involves…
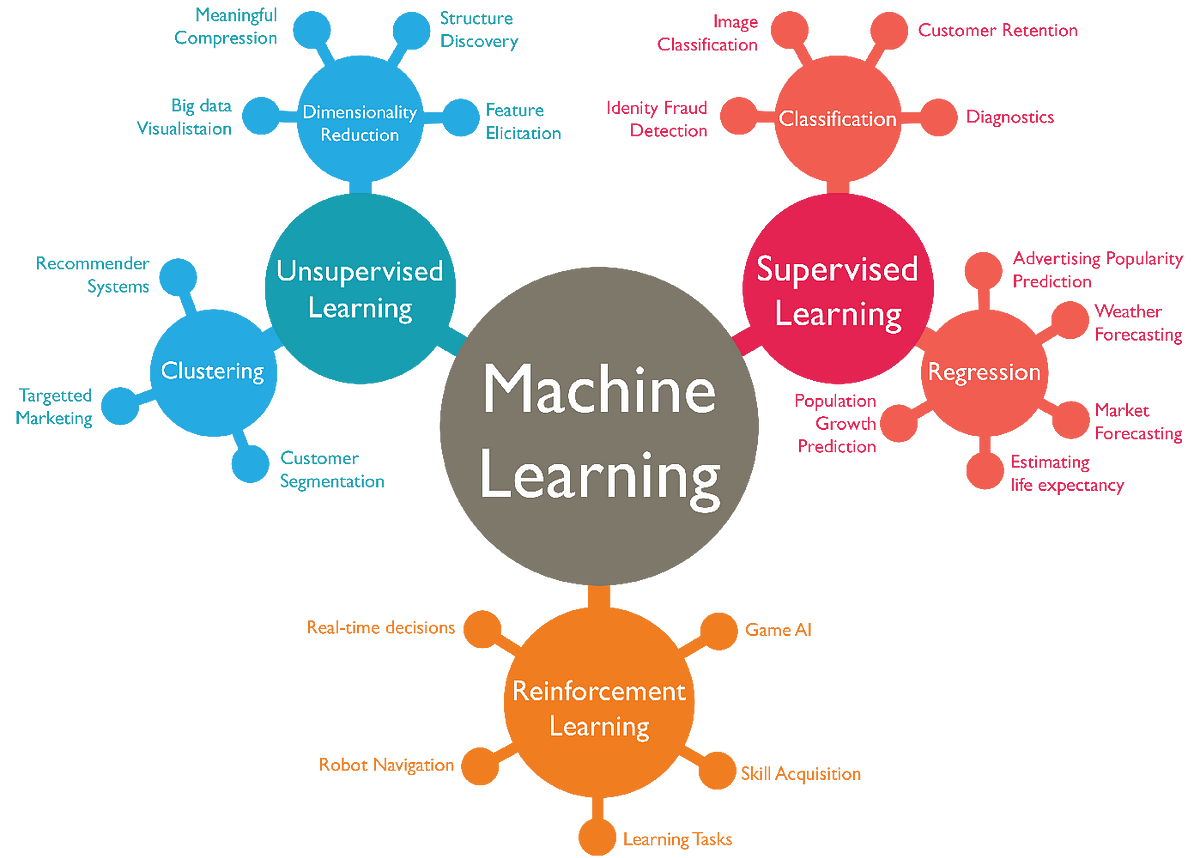
2. Various kinds of machine learning
There are lots of different kinds of machine learning out there. You might only associate ML with the kind of deep neural networks you see discussed by Google. But there are many kinds. Look at the image below:

See anything that looks familiar? Regression is a whole category and OLS is one kind of machine learning. The diagram above is based on algorithmic approaches but here is another based on the process:
from IPython.display import YouTubeVideo
YouTubeVideo("TJveOYsK6MY",width=640,height=360)
Question 6: Look up the terms “Supervised”, “Unsupervised” and “Reinforcement” Learning. Provide a brief definition of each below. You could of course copy from somewhere, but see if you can do it in your own terms
✎ Supervised learning is:
✎ Unsupervised learning is:
✎ Reinforcement learning is:
3. Classification
Classification represents a group of algorithms that map observations (features) into class labels. We’ve seen examples of classification before. The Iris data set is an example of mapping a set of observations, 4 features per observation, into one of three class labels, a particular Iris type. It’s easy to imagine many applications and there are multiple algorithms focus on the classification task.
Classification is a supervised learning task. One of the principal concerns we have for a classifier is how often it makes mistakes (i.e., false positives and false negatives relative to its true predictions)
from IPython.display import YouTubeVideo
YouTubeVideo("Ivc8c9ijWIQ",width=640,height=360)
Question 7: After watching this video explain in your own words the concepts of false positives and false negatives. Feel free to use your own examples.
✎ Answer here.
3.1 Making some data
We spend a lot of time reading in data but sometimes it is easier to generate some data, under our control, and see what we get. To get a better handle on how easy/hard classification might be, we can use the function make_classification
This function is part of the sklearn library, which is the standard for machine learning in python, much like pandas is the standard for data handling. We have used statsmodels in the past, mostly for its improved statistical properties, but sklearn is a big, broad, and well maintained library. We will use it a lot during the rest of the class as will you in your data science future.
Take a look at the make-classification documentation. It has a lot of parts but most are fairly clear:
how many samples
how many features
how many of those features are:
informative
redundant (basically random noise)
repeated (some combo of informative and redundant)
number of classes (how many labels)
It returns two values: an array of shape(n_samples, n_features) and the integer labels (the class they belong to) for each sample.
You can look at the rest or take defaults.
Let’s start by making a scatter plot of a sample of data with 3 features including 1 that is redundant with only 1 cluster per class (i.e., 1 grouping per labeled class). Because we have 3 features, we should look at scatter plots of each pair of features. Note that we use c=class_labels to send class_labels to the color attribute, which colorizes different classes.
### your code here
Given your plots (you might run the code a few times), what does a “redundant feature” appear to be?
✎ Answer here.
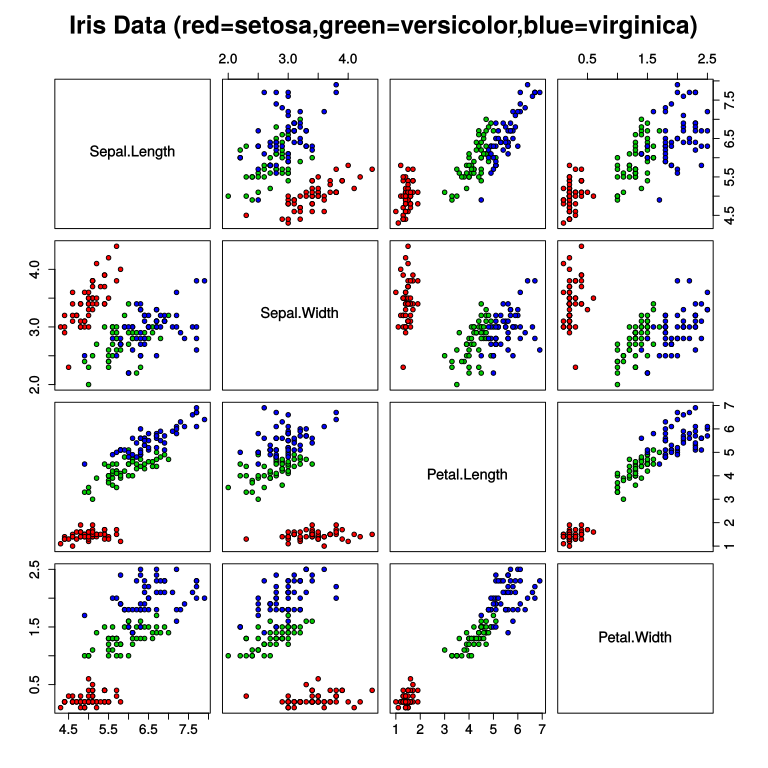
3.2 Plot some examples
Some data are easier to classify than others. You might remember this from the work we did with the iris data set earlier in the semester. As a reminder, we include a plot of the iris data set below along with the classfication of each sample.
Let’s plot some examples of made-up data to explore in what way we might find it easier or difficult to classify that data. Please generate:
100 samples (that’s the default), 2 features, no redundant features, one informative feature, one cluster per class
100 samples (that’s the default), 2 features, no redundant features, two informative features, one cluster per class
100 samples (that’s the default), 4 features, two redundant features, two informative features, one cluster per class
100 samples (that’s the default), 4 features, two redundant features, two informative features, two clusters per class
Make a scatter plot of these data. For the data with 4 features, you might want to look at different pairs of features before answering the question below.
# your code here
Given the plots here, which of these would be easiest to classify? Why? You might think back to the iris data set if it helps.
✎ Answer here.
4. Getting Started with Classification: Logistic Regression
We will learn a variety of classifiers in this class. We will start with one of the most widely used ones: Logistic Regression. The video below provides a conceptual explanation of the technique.
from IPython.display import YouTubeVideo
YouTubeVideo("yIYKR4sgzI8",width=640,height=360)
Think about a situation where you might want to classify some set of things using logistic regression. What is that set? What are the classes? And what kinds of features would you use to build that model?
✎ Answer here.