Solution - Exploring data with Pandas
Contents
Solution - Exploring data with Pandas
Today, we will:
Make sure that everyone remembers how to do the basics with
pandas.Do some data analysis with existing data sets.
Make some visualizations of the data.
Notebook instructions
Work through the notebook making sure to write all necessary code and answer any questions.
Useful imports (make sure to execute this cell!)
Let’s get a few of our imports out of the way. If you find others you need to add, consider coming back and putting them here.
# necessary imports for this notebook
%matplotlib inline
import pandas as pd
from pandas.plotting import scatter_matrix
1. Review of pandas
Let’s take a moment to highlight some key concepts. Discuss with your group mates the following prompts and write down a brief definition of each of these concepts.
If you don’t feel like you have good working definitions yet, try doing a quick internet search to see if you can find a definition that makes sense to you.
✅ Question 1: What are the features of a Pandas Series?
Great resource here
✅ Question 2: What are the differences between a DataFrame and a Series?
Nice comparison here
2. Loading and exploring a dataset
The goal is typically to read some sort of preexisting data into a DataFrame so we can work with it.
Pandas is pretty flexible about reading in data and can read in a variety of formats. However, it sometimes needs a little help. Let’s start with a “toy” dataset, the Iris Data set .
A toy dataset is often one that has a particularly nice set of features or is of a manageable size such that it can be used as a good dataset for learning new data analysis techiques or testing out code. This allows one to focus on the code and data science methods without getting too caught up in wrangling the data. However, data wrangling is an authentic part of doing any sort of meaningful data analysis as data more often messier than not.
Although you will be working with a toy dataset today, you may still have to do a bit of wrangling along the way.
2.1 Getting used to looking for useful information on the internet
Another authentic part of working as a computational professional is getting comfortable with searching for help on the internet when you get stuck or run into something that is unfamiliar to you. The Python data analysis/computional modeling world can be complicated and is ever-evolving. There is also a large number of publicly available toolsets with varying levels of complexity and nuance. Through practice and experience, we become better computational folks by learning how to search for better, more efficient, clearer ways to do things.
The Iris data
The iris data set is pretty straight forward (review the wikipedia link above if you haven’t yet), especially if someone has done all of the data wrangling and cleaning for you. To make it a little more interesting we provide it in a raw form that you might encounter with other data.
✅ Do This: To get started, you’ll need to download the following two files:
Once you’ve done so, you should have access to the following : iris.data and iris.names. Open them both and discuss what you see. This is a good opportunity to use you favorite text editor or use something new. Feel free to ask your group members or instructors what they prefer to use.
✅ Question 3: Describe the data and the information in the names file. What characteristics are provided there? Perhaps the iris dataset link above will help.
✎ Do This - Erase the contents of this cell and replace it with your answer to the above question! (double-click on this text to edit this cell, and hit shift+enter to save the text). Practice using appropriate Markdown formating to make your answer’s easy to read.
2.2 Reading in a file
Pandas supports a number of file formats, but one of the most common is the one provided by the read_csv function. Typically, the phrase csv stands for “comma separated values”, a text file format that excel and other spread sheets use. In a typical csv file, each line represents a line in a spreadsheet and each cell value is separated from the next by a comma.
However, you can use other separators as well. Look at the documentation for read_csv.
✅ Do This: Read the iris.data file into your notebook with the appropriate column headers. Display the DataFrame to make sure it looks reasonable.
# replace this cell with code to read in the iris.data file with column headers. Use appropriate headers!

## Note we name the columns in this case because the data file didn't include column names

iris_df = pd.read_csv('https://raw.githubusercontent.com/dannycab/MSU_REU_ML_course/main/notebooks/day-1/iris.data',
                     names = ['sepal length', 'sepal width', 'petal length', 'petal width', 'species'],
                     sep = ' ')

iris_df.head()
| sepal length | sepal width | petal length | petal width | species | |
|---|---|---|---|---|---|
| 0 | 5.1 | 3.5 | 1.4 | 0.2 | Iris-setosa |
| 1 | 4.9 | 3.0 | 1.4 | 0.2 | Iris-setosa |
| 2 | 4.7 | 3.2 | 1.3 | 0.2 | Iris-setosa |
| 3 | 4.6 | 3.1 | 1.5 | 0.2 | Iris-setosa |
| 4 | 5.0 | 3.6 | 1.4 | 0.2 | Iris-setosa |
2.3 Describing your data
The .describe() methods tells you about the data. If the data is too big to see (height and width) you can use the two options below to show more of the data. You can change the values to suit your needs.
# expand what is shown (rows and cols) by pandas, any time you change default options -- be thoughtful about your choices!
pd.set_option('display.max_rows', 500)
pd.set_option('display.max_columns', 500)
✅ Do This: Run the .describe() method on the data you read in. If you think about how you might classify the species contained in the dataset based on the four available features, can you discern anything helpful? Put your answer in the cell below.
# Put your code here
iris_df.describe()
| sepal length | sepal width | petal length | petal width | |
|---|---|---|---|---|
| count | 150.000000 | 150.000000 | 150.000000 | 150.000000 |
| mean | 5.843333 | 3.054000 | 3.758667 | 1.198667 |
| std | 0.828066 | 0.433594 | 1.764420 | 0.763161 |
| min | 4.300000 | 2.000000 | 1.000000 | 0.100000 |
| 25% | 5.100000 | 2.800000 | 1.600000 | 0.300000 |
| 50% | 5.800000 | 3.000000 | 4.350000 | 1.300000 |
| 75% | 6.400000 | 3.300000 | 5.100000 | 1.800000 |
| max | 7.900000 | 4.400000 | 6.900000 | 2.500000 |
✎ Do This - Erase the contents of this cell and replace it with your answer. Did you find any useful features? What makes those features useful in classfying the species of the irises?
2.4 Grouping your data
You can perform operations to group elements using the .groupby() method. The result of the use of .groupby is a GroupBy object. If you were to print it you see only the class instance name as nothing is computed until an operation is performed on the groups, much like other iterators. However, you can use .describe() on the result of a .groupby() call. If you haven’t used this before, you may need to consult the documentation for .groupby()
✅ Do This: Make a GroupBy object using the iris DataFrame and group by the class/species of the data. Then run .describe() on the group result. Now take a look at the data from the group. Thinking again about classification, do you see any data features you could use to classify the data when you look at it this way?
# Put your code here

iris_df.groupby('species').describe()
| sepal length | sepal width | petal length | petal width | |||||||||||||||||||||||||||||
|---|---|---|---|---|---|---|---|---|---|---|---|---|---|---|---|---|---|---|---|---|---|---|---|---|---|---|---|---|---|---|---|---|
| count | mean | std | min | 25% | 50% | 75% | max | count | mean | std | min | 25% | 50% | 75% | max | count | mean | std | min | 25% | 50% | 75% | max | count | mean | std | min | 25% | 50% | 75% | max | |
| species | ||||||||||||||||||||||||||||||||
| Iris-setosa | 50.0 | 5.006 | 0.352490 | 4.3 | 4.800 | 5.0 | 5.2 | 5.8 | 50.0 | 3.418 | 0.381024 | 2.3 | 3.125 | 3.4 | 3.675 | 4.4 | 50.0 | 1.464 | 0.173511 | 1.0 | 1.4 | 1.50 | 1.575 | 1.9 | 50.0 | 0.244 | 0.107210 | 0.1 | 0.2 | 0.2 | 0.3 | 0.6 |
| Iris-versicolor | 50.0 | 5.936 | 0.516171 | 4.9 | 5.600 | 5.9 | 6.3 | 7.0 | 50.0 | 2.770 | 0.313798 | 2.0 | 2.525 | 2.8 | 3.000 | 3.4 | 50.0 | 4.260 | 0.469911 | 3.0 | 4.0 | 4.35 | 4.600 | 5.1 | 50.0 | 1.326 | 0.197753 | 1.0 | 1.2 | 1.3 | 1.5 | 1.8 |
| Iris-virginica | 50.0 | 6.588 | 0.635880 | 4.9 | 6.225 | 6.5 | 6.9 | 7.9 | 50.0 | 2.974 | 0.322497 | 2.2 | 2.800 | 3.0 | 3.175 | 3.8 | 50.0 | 5.552 | 0.551895 | 4.5 | 5.1 | 5.55 | 5.875 | 6.9 | 50.0 | 2.026 | 0.274650 | 1.4 | 1.8 | 2.0 | 2.3 | 2.5 |
✎ Do this - Erase this and put your answer here. Did you find any useful features? What makes those features useful in classfying the species of the irises? How did using .groupby() help (or not) in finding useful features?
3. Visualizing your data
We are often limited in understanding our data because it is complex, has many features, or is quite large. In these situations, visualizations (plots, charts, and graphs) can help represent our data in ways that help us gain greater insight into the trends, features, and classes we want to understand.
3.1 Making a scatter matrix
Rather than just looking at the raw values or exploring basic statistical values for our data, it would be better if we were to visualize the differences. Since the number of features is small, we can use a plotting feature of Pandas called scatter_matrix(). Did you noticed that we imported scatter_matrix at the start of this notebook?
✅ Do This: Try calling the scatter_matrix function on your dataframe. Use a marker that you prefer. Look up the documentation for scatter_matrix on the Pandas website for more information! You may need to make the figure bigger to get a good look at it.
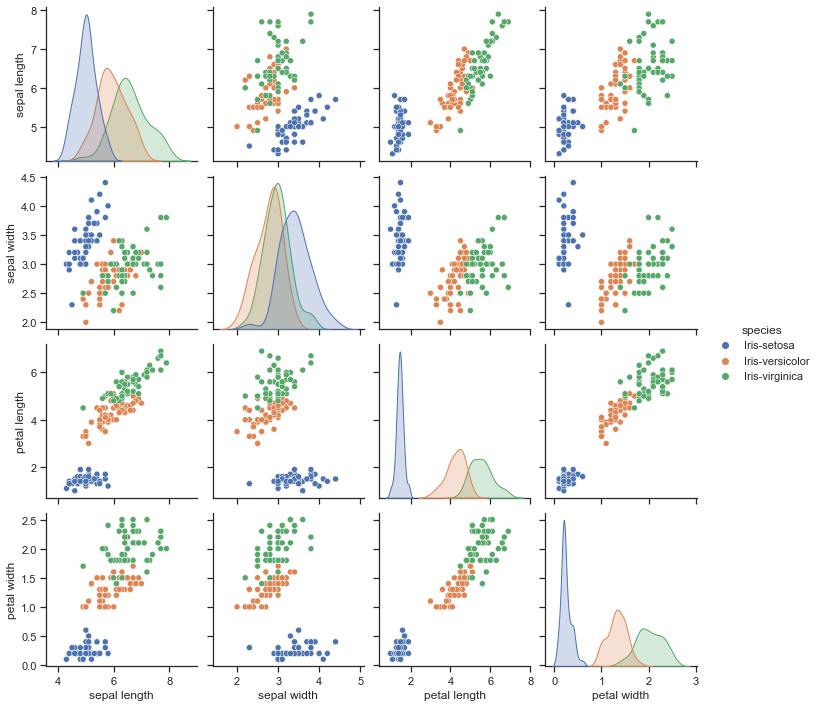
Note: There is a similar sort of plot that can be made with the seaborn package, which you may have seen before. If so, do you remember what it is?
# your code here

# Pandas

pd.plotting.scatter_matrix(iris_df,
                          figsize = (8,8),
                          alpha = 0.5);

## Seaborn (NOTE THIS SOLVES THE NEXT PROBLEM AUTOMATICALLY)

import seaborn as sns
sns.set_theme(style="ticks")
sns.pairplot(iris_df, hue="species")
<seaborn.axisgrid.PairGrid at 0x15d1e30a0>
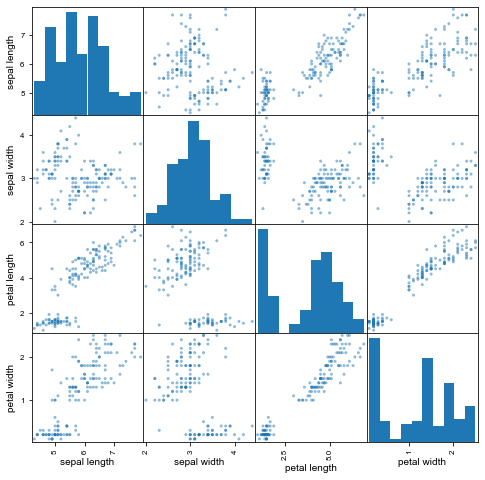
✅ Question 4: Does this visualization help you to determine the features that might be useful for classification? Why or why not?
✎ Do This - Erase the contents of this cell and replace it with your answer to the above question! (double-click on this text to edit this cell, and hit shift+enter to save the text). Practice using appropriate Markdown formating to make your answers easy to read.
3.2 Color coding your data
The default scatter matrix probably isn’t as helpful as we might hope as it’s impossible to tell which points on the plot represent our classes/sepcies.
We could really use a separate color indication for each dot so we can tell the species apart. Essentially, we need to create an array such that, for each observation in the DataFrame, we can assign a color value to associate it with the appropriate species. It could be just an integer, or it could be one of the standard colors such as “red”.
✅ Do This: Create a new list, array, or Pandas Series object that maps each species to a particular color. Then recreate the scatter matrix using the c argument to give the points in the plot different colors.
# your code here

color = []
color_dict = {'Iris-setosa':'r',
              'Iris-versicolor':'g',
              'Iris-virginica':'b'}

for x in iris_df['species']:

    if x in color_dict:
        color.append(color_dict[x])

    else:
        raise ValueError('No species found in data')
        break;

pd.plotting.scatter_matrix(iris_df,
                          figsize = (8,8),
                          alpha = 0.5,
                          c = color);
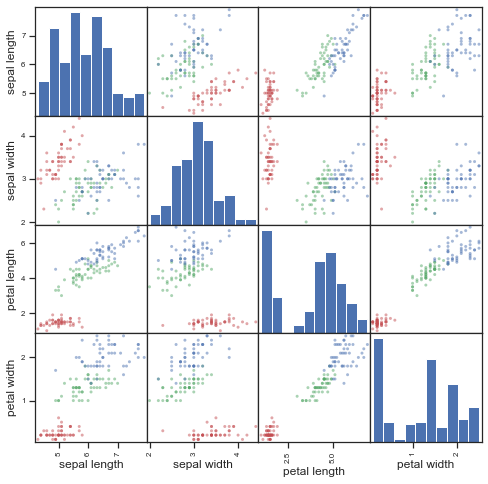
Hope you got something that’s a little more useful! OK, how do we read this now?
The diagonal shows the distribution of the four numeric variables of our example data.
In the other cells of the plot matrix, we have the scatterplots (i.e. correlation plot) of each variable combination of our dataframe.
✅ Question 5: Are you better able to discern features that might be useful in classfying irises? What can you say about the features of each iris species? Can you separate one species easily? If so, using which feature(s)?
✎ Do This - Erase the contents of this cell and replace it with your answer to the above question! (double-click on this text to edit this cell, and hit shift+enter to save the text). Practice using appropriate Markdown formating to make your answers easy to read.
3.3 Separating species of irises
Now we will use the feature(s) you found above to try to separate iris species. In future parts of the course, we may explore how to do this using models, but for now, you will try to do this by slicing the DataFrame.
✅ Do This: One of these species is obviously easier to separate than the others. Can you use a Boolean mask on the dataframe and isolate that one species using the features and not the species label? Try to do so below and confirm that you were successful.
# Put your code here

## From the graph it looks like we can get Iris-Setosa separated.

iris_df[iris_df['petal length'] < 2] #(only setosa)

#iris_df[iris_df['petal length'] > 2] #(versicolor and virginica)
| sepal length | sepal width | petal length | petal width | species | |
|---|---|---|---|---|---|
| 0 | 5.1 | 3.5 | 1.4 | 0.2 | Iris-setosa |
| 1 | 4.9 | 3.0 | 1.4 | 0.2 | Iris-setosa |
| 2 | 4.7 | 3.2 | 1.3 | 0.2 | Iris-setosa |
| 3 | 4.6 | 3.1 | 1.5 | 0.2 | Iris-setosa |
| 4 | 5.0 | 3.6 | 1.4 | 0.2 | Iris-setosa |
| 5 | 5.4 | 3.9 | 1.7 | 0.4 | Iris-setosa |
| 6 | 4.6 | 3.4 | 1.4 | 0.3 | Iris-setosa |
| 7 | 5.0 | 3.4 | 1.5 | 0.2 | Iris-setosa |
| 8 | 4.4 | 2.9 | 1.4 | 0.2 | Iris-setosa |
| 9 | 4.9 | 3.1 | 1.5 | 0.1 | Iris-setosa |
| 10 | 5.4 | 3.7 | 1.5 | 0.2 | Iris-setosa |
| 11 | 4.8 | 3.4 | 1.6 | 0.2 | Iris-setosa |
| 12 | 4.8 | 3.0 | 1.4 | 0.1 | Iris-setosa |
| 13 | 4.3 | 3.0 | 1.1 | 0.1 | Iris-setosa |
| 14 | 5.8 | 4.0 | 1.2 | 0.2 | Iris-setosa |
| 15 | 5.7 | 4.4 | 1.5 | 0.4 | Iris-setosa |
| 16 | 5.4 | 3.9 | 1.3 | 0.4 | Iris-setosa |
| 17 | 5.1 | 3.5 | 1.4 | 0.3 | Iris-setosa |
| 18 | 5.7 | 3.8 | 1.7 | 0.3 | Iris-setosa |
| 19 | 5.1 | 3.8 | 1.5 | 0.3 | Iris-setosa |
| 20 | 5.4 | 3.4 | 1.7 | 0.2 | Iris-setosa |
| 21 | 5.1 | 3.7 | 1.5 | 0.4 | Iris-setosa |
| 22 | 4.6 | 3.6 | 1.0 | 0.2 | Iris-setosa |
| 23 | 5.1 | 3.3 | 1.7 | 0.5 | Iris-setosa |
| 24 | 4.8 | 3.4 | 1.9 | 0.2 | Iris-setosa |
| 25 | 5.0 | 3.0 | 1.6 | 0.2 | Iris-setosa |
| 26 | 5.0 | 3.4 | 1.6 | 0.4 | Iris-setosa |
| 27 | 5.2 | 3.5 | 1.5 | 0.2 | Iris-setosa |
| 28 | 5.2 | 3.4 | 1.4 | 0.2 | Iris-setosa |
| 29 | 4.7 | 3.2 | 1.6 | 0.2 | Iris-setosa |
| 30 | 4.8 | 3.1 | 1.6 | 0.2 | Iris-setosa |
| 31 | 5.4 | 3.4 | 1.5 | 0.4 | Iris-setosa |
| 32 | 5.2 | 4.1 | 1.5 | 0.1 | Iris-setosa |
| 33 | 5.5 | 4.2 | 1.4 | 0.2 | Iris-setosa |
| 34 | 4.9 | 3.1 | 1.5 | 0.1 | Iris-setosa |
| 35 | 5.0 | 3.2 | 1.2 | 0.2 | Iris-setosa |
| 36 | 5.5 | 3.5 | 1.3 | 0.2 | Iris-setosa |
| 37 | 4.9 | 3.1 | 1.5 | 0.1 | Iris-setosa |
| 38 | 4.4 | 3.0 | 1.3 | 0.2 | Iris-setosa |
| 39 | 5.1 | 3.4 | 1.5 | 0.2 | Iris-setosa |
| 40 | 5.0 | 3.5 | 1.3 | 0.3 | Iris-setosa |
| 41 | 4.5 | 2.3 | 1.3 | 0.3 | Iris-setosa |
| 42 | 4.4 | 3.2 | 1.3 | 0.2 | Iris-setosa |
| 43 | 5.0 | 3.5 | 1.6 | 0.6 | Iris-setosa |
| 44 | 5.1 | 3.8 | 1.9 | 0.4 | Iris-setosa |
| 45 | 4.8 | 3.0 | 1.4 | 0.3 | Iris-setosa |
| 46 | 5.1 | 3.8 | 1.6 | 0.2 | Iris-setosa |
| 47 | 4.6 | 3.2 | 1.4 | 0.2 | Iris-setosa |
| 48 | 5.3 | 3.7 | 1.5 | 0.2 | Iris-setosa |
| 49 | 5.0 | 3.3 | 1.4 | 0.2 | Iris-setosa |
✅ Do This: Can you write a sequence of Boolean masks that separate the other two as well? Are these as effective as the first? Can you think of anything you might do to improve the separation?
# your code here

## Looking back maybe petal width can help here

iris_df[(iris_df['petal length'] > 2) & (iris_df['petal width'] < 1.5)] ## We can get pretty close (all versicolor, but one)

#iris_df[(iris_df['petal length'] > 2) & (iris_df['petal width'] > 1.5)] ## Again, we can get pretty close (all virginica, but five)

## Machine Learning Classifiers can combine features and might work better for us
| sepal length | sepal width | petal length | petal width | species | |
|---|---|---|---|---|---|
| 50 | 7.0 | 3.2 | 4.7 | 1.4 | Iris-versicolor |
| 53 | 5.5 | 2.3 | 4.0 | 1.3 | Iris-versicolor |
| 55 | 5.7 | 2.8 | 4.5 | 1.3 | Iris-versicolor |
| 57 | 4.9 | 2.4 | 3.3 | 1.0 | Iris-versicolor |
| 58 | 6.6 | 2.9 | 4.6 | 1.3 | Iris-versicolor |
| 59 | 5.2 | 2.7 | 3.9 | 1.4 | Iris-versicolor |
| 60 | 5.0 | 2.0 | 3.5 | 1.0 | Iris-versicolor |
| 62 | 6.0 | 2.2 | 4.0 | 1.0 | Iris-versicolor |
| 63 | 6.1 | 2.9 | 4.7 | 1.4 | Iris-versicolor |
| 64 | 5.6 | 2.9 | 3.6 | 1.3 | Iris-versicolor |
| 65 | 6.7 | 3.1 | 4.4 | 1.4 | Iris-versicolor |
| 67 | 5.8 | 2.7 | 4.1 | 1.0 | Iris-versicolor |
| 69 | 5.6 | 2.5 | 3.9 | 1.1 | Iris-versicolor |
| 71 | 6.1 | 2.8 | 4.0 | 1.3 | Iris-versicolor |
| 73 | 6.1 | 2.8 | 4.7 | 1.2 | Iris-versicolor |
| 74 | 6.4 | 2.9 | 4.3 | 1.3 | Iris-versicolor |
| 75 | 6.6 | 3.0 | 4.4 | 1.4 | Iris-versicolor |
| 76 | 6.8 | 2.8 | 4.8 | 1.4 | Iris-versicolor |
| 79 | 5.7 | 2.6 | 3.5 | 1.0 | Iris-versicolor |
| 80 | 5.5 | 2.4 | 3.8 | 1.1 | Iris-versicolor |
| 81 | 5.5 | 2.4 | 3.7 | 1.0 | Iris-versicolor |
| 82 | 5.8 | 2.7 | 3.9 | 1.2 | Iris-versicolor |
| 87 | 6.3 | 2.3 | 4.4 | 1.3 | Iris-versicolor |
| 88 | 5.6 | 3.0 | 4.1 | 1.3 | Iris-versicolor |
| 89 | 5.5 | 2.5 | 4.0 | 1.3 | Iris-versicolor |
| 90 | 5.5 | 2.6 | 4.4 | 1.2 | Iris-versicolor |
| 91 | 6.1 | 3.0 | 4.6 | 1.4 | Iris-versicolor |
| 92 | 5.8 | 2.6 | 4.0 | 1.2 | Iris-versicolor |
| 93 | 5.0 | 2.3 | 3.3 | 1.0 | Iris-versicolor |
| 94 | 5.6 | 2.7 | 4.2 | 1.3 | Iris-versicolor |
| 95 | 5.7 | 3.0 | 4.2 | 1.2 | Iris-versicolor |
| 96 | 5.7 | 2.9 | 4.2 | 1.3 | Iris-versicolor |
| 97 | 6.2 | 2.9 | 4.3 | 1.3 | Iris-versicolor |
| 98 | 5.1 | 2.5 | 3.0 | 1.1 | Iris-versicolor |
| 99 | 5.7 | 2.8 | 4.1 | 1.3 | Iris-versicolor |
| 134 | 6.1 | 2.6 | 5.6 | 1.4 | Iris-virginica |
✎ Do This - Erase the contents of this cell and replace it with your answer. How effective your Boolean mask separation of the 3 species? Any ideas for improvements?
🛑 You made it to the end!
Is there anything that we covered today that you’re still not feeling certain about? Talk to your group or check in with an instructor.